Business Cycle Index Indicates Relatively Slow Growth in San Antonio and Houston

The Business-Cycle Index is produced by the Federal Reserve Bank of Dallas and “measures broad movements in local economic conditions. The indexes are constructed based on the aggregated movements in the local area unemployment rate, nonagricultural employment, inflation-adjusted wages and inflation-adjusted retail sales taxes.”1 While gross domestic product (GDP) is the most commonly used measure of movements in the national macroeconomy, there is a lag in the GDP figures produced for the states and metropolitan areas. The Business-Cycle Index fills this void by providing a more recent measure of the movements of the macroeconomy at the state and metropolitan area levels.

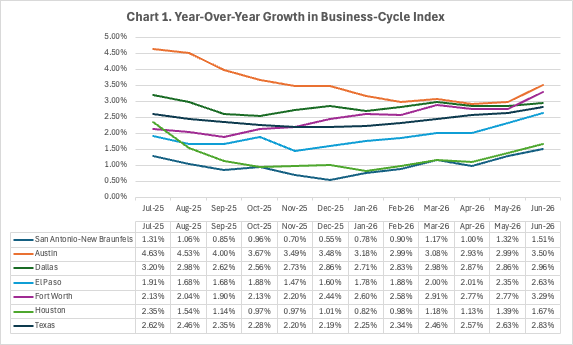
As shown in Chart 1, growth has accelerated since the end of last year for the state and in all of the major metropolitan areas. However, the Houston and San Antonio-New Braunfels metropolitan economies saw their growth slow much more in the first six months of this time period, and while their growth rates have been accelerating in the last six months through June, they are lagging the growth in the other metropolitan areas by a sizeable margin. For instance, year-over-year growth in the San Antonio-New Braunfels and Houston economies was 1.51% and 1.67%, respectively in June. This is compared to 3.50% growth in Austin and 3.29% growth in Fort Worth with the state economy growing 2.83%.
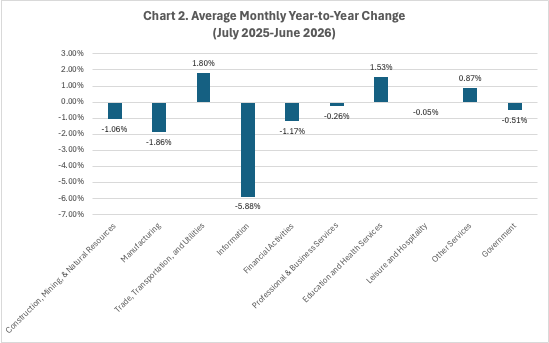
Since the San Antonio-New Braunfels economy had the slowest growth, I took a look at what has been happening to employment growth by industry in this area. I calculated the year-over-year growth in employment for each month from July 2025 through June 2026 and averaged the growth rates. Chart 2 shows these growth rates. The slow growth rate in San Antonio-New Braunfels is broad-based, as seven of the ten industries had negative average growth rates. Only the trade, transportation, and utilities; education and health services; and other services industries had positive growth. The largest decline was in the information industry followed by manufacturing, and financial activities. It is also worth keeping in mind that these average figures do not indicate changes in growth in any of the months over this time period. For instance, professional and business services had an average growth of -0.26% over the twelve month period, but this masks that in the first eight months employment growth was negative in each month, while in the last four months, the industry had positive employment growth each month, so it seems to have turned the corner to growth.
  1. Federal Reserve Bank of Dallas. Business-Cycle Indexes. https://www.dallasfed.org/research/econdata/mbci ↩︎

Steve

Weak Labor Market Continues into July

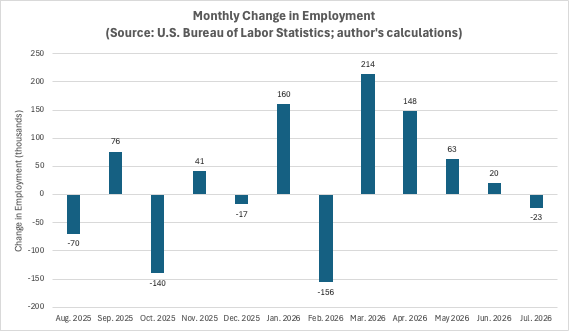
Employment in the U.S. declined by 23,000 jobs in July.1 As shown in the following chart, this continues a pattern of slowing growth since April of this year, and rather anemic growth from month-to-month over the past months. However, the unemployment rate declined from 4.2% in June to 4.1% July, which on the face of it seems odd given the decline in employment. The decline in the unemployment rate is due to the fact that 381,000 people dropped out of the labor force, so they are not counted as unemployed. This is another indication of weakness in the labor market and has been happening for several months.2 The weak labor market coincides with relatively weak growth in gross domestic product.3

Growth in the U.S. economy has been rather weak, but inflation continues to be high at 3.5% as of June.4 Stagnant growth with relatively high inflation indicates to me that the U.S. economy is in a stagflation, albeit a somewhat mild one, and has been for some time.

  1. U.S. Bureau of Labor Statistics. August 7, 2026. Employment Situation Report. p. 1. https://www.bls.gov/news.release/pdf/empsit.pdf ↩︎
  2. U.S. Bureau of Labor Statistics. August 7, 2026. Employment Situation Report. Table A-1. https://www.bls.gov/news.release/pdf/empsit.pdf ↩︎
  3. U.S. Bureau of Economic Analysis. July 30, 2026. GDP Advance Estimate, 2nd Quarter 2026. https://www.bea.gov/news/2026/gdp-advance-estimate-2nd-quarter-2026 ↩︎
  4. U.S. Bureau of Labor Statistics. July 14, 2026. Consumer Price Index – June 2026. https://www.bls.gov/news.release/pdf/cpi.pdf ↩︎

Steve

The Economic Impacts and Return on Investment of San Antonio Ready to Work

I recently completed a study of the economic impacts of the San Antonio Ready to Work program in collaboration with my colleague, Dr. Belinda Roman. The full report can be found here. The analysis projected the increase in incomes over the careers of those participants who completed their training and are placed into jobs, the economic impacts of the spending resulting from the increased incomes, and the savings to various social programs (e.g., Medicaid, WIC, TANF) that they will no longer need because of their increased earnings. These results are shown in the following table. The total benefits will amount to about $11.8 billion, and compared against the total program costs of $94.3 million, the return on investment will amount to $125 in benefits per dollar spent.

Investment in programs focused on workforce development like San Antonio Ready to Work are fundamental to the continued development of the San Antonio economy. Their importance may be enhanced in the future given the potential disruptive effects of AI on the labor market in the future.

The Contrast of Employment Growth in San Antonio

The Federal Reserve Bank of Dallas recently posted an interesting article in which it discussed the slowing growth in Texas as employment growth slowed in June. However, this has not been the case in the San Antonio-New Braunfels metropolitan area. As shown in the following chart, employment growth in San Antonio picked up pace in May and June in contrast to the state economy and the other major metropolitan economies in Texas. Employment growth in San Antonio was faster than all of the other major metropolitan economies but just slightly lower than the growth in the state. Employment across the state grew 1.64% while employment grew 1.59% in San Antonio in June (Table 1). While growth in San Antonio is relatively stronger than the other major metropolitan economies, it is still below the long-term average growth rate of 2.30%.

The figures in Table 2 show the growth rates by industry in San Antonio. The growth rates highlighted in green show those growth rates across each industry that accelerated during this time period. This shows that the employment growth in San Antonio over the three months from April through June have been driven by construction, mining, and natural resources; manufacturing; trade, transportation, and utilities; financial activities; education and health services; and leisure and hospitality. Construction grew on average 2.32% over this six-month period with the biggest acceleration coming in May and June, while mining and natural resources declined -0.45% over this period. For those who live in San Antonio, it is probably no surprise that construction drove the growth in this sector. Growth in education and health services was driven by growth in health services with an average monthly expansion of 4.09% over this period. Employment in private education health services shrank -1.88% on average each month. Keep in mind that this is just private education health services, as the public schools are captured in local government.

While the state and metropolitan economies are still expanding as measured by employment growth, their growth is slowing. Maybe San Antonio continues to lead the pack in growth, but I do expect overall growth to continue to be anemic and likely even slow more across the state and the U.S.

Steve

Unemployment Continues to Improve…With a Caveat

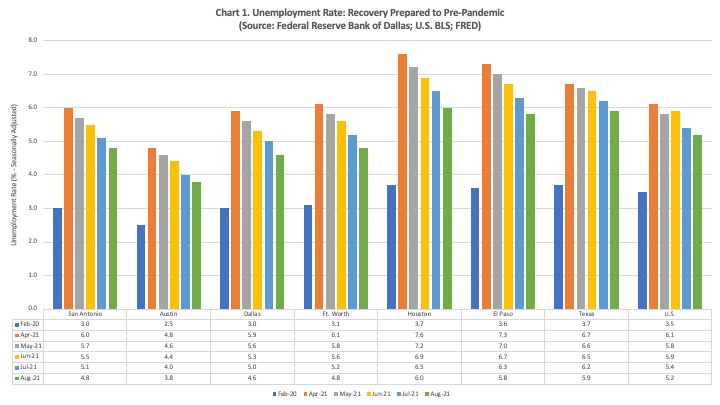
The unemployment rate continued its decline in August across the major metropolitan economies in Texas and across the State and U.S. as the recovery from the economic effects of the pandemic continue (see Chart 1). In San Antonio, the unemployment rate declined to 4.8%, This is 1.8 percentage points above the pre-pandemic level, so while the economy is certainly recovering, there is still a ways to go. San Antonio has the third lowest unemployment rate compared to the other major metropolitan economies in Texas with Austin having the lowest at 3.8%. The unemployment rate in Texas stood at 5.9%, a bit higher than the unemployment rate for the U.S. at 5.2%.

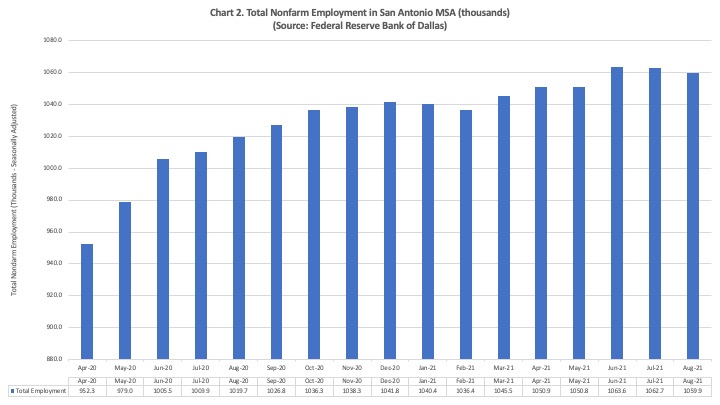
However, the total level of employment in San Antonio declined in July and August, as shown in Chart 2. This indicates to me that at least part of the decline in the unemployment rate in San Antonio may be due to people dropping out of the labor force and therefore, no longer being counted in the unemployment rate. This is also occurring in some of the other major metropolitan economies across the state.

While there have been monthly declines in total employment the past couple of months, the year-over-year growth rates in employment continued to be strong in August with growth in San Antonio coming in at 3.94% (see Chart 3), a good bit above the average historical growth rate in the region of about 2.3%. However, these growth rates continue to decline across most regions in the state, as well as across the entire state of Texas and the U.S. This is likely due to a regression to the mean as the recovery continues and some pull back in consumer spending due to the Delta variant. Another possible factor is the lag in business travel due to the pandemic. This especially affects those local economies with large leisure and hospitality industries like San Antonio because the convention activity is not filling in for the decline in leisure travel as the new school year began.

If we can keep making strides against the pandemic, growth should continue into the near future. This does not mean the year-over-year growth rates will increase, as they will likely tend to move more toward their long-term average rates in the respective areas as the economy gets closer to full employment. The sustained growth will also continue to push the unemployment rates down, especially as the structural unemployment is reduced.