U.S. Economic Growth May Actually be Slowing

In my speeches, classes, or whenever I am asked about the state of the economy, I will frequently stress the need to look behind the headline economic numbers to get a better sense of what is happening in the economy and where it might be headed. This is arguably more important during these extraordinarily uncertain economic times, as illustrated by the current release of the U.S. real gross domestic product (GDP) figures.

U.S. real gross domestic product grew by 3.0% in the second quarter of this year. This follows a decline of 0.5% in the first quarter (U.S. Bureau of Economic Analysis). While the growth in the second quarter seems to indicate the economy has rebounded from the decline in the first quarter, it is necessary to look a bit deeper in the figures because these big swings in growth were driven by historically large changes in net exports. More specifically, it was large changes in imports as business substantially increased their imports in the first quarter to get ahead of the tariffs and then pulled back in the second quarter. This is shown in the following chart of the contribution in percent change in real gross domestic product attributed to net exports. The data in the chart go back to the fourth quarter of 1947 covering all data available, The contribution in percent change in real gross domestic product derived from net exports was -4.61 in the the first quarter of this year and 4.99 in the second quarter. It is clear from the graph that these are the largest swings in the contribution of net exports to the change in GDP in history. Net exports are the value of exports minus the value of imports, so the negative contribution of net exports in the first quarter is due to the very large increase in imports and the reverse of that in the second quarter.

To get a clearer picture of how the economy grew over the first two quarters of 2025, we need to look at the change in real final sales to private domestic purchasers calculated as “the sum of consumer spending and gross private fixed investment [i.e., capital expenditures]” (U.S. Bureau of Economic Analysis). This removes the volatile components of GDP – net exports and inventories – and provides a “cleaner” measure of private domestic demand with a focus on domestic demand since net exports are removed.

The following graph shows the growth in real final sales to private domestic purchasers for each quarter since the first quarter of 2021. The picture of economic growth looks vastly different by this measure, since it has declined in each quarter since the third quarter of 2024. In the first quarter of 2025 real final sales to domestic purchasers grew 1.9%, but the growth rate declined to 1.2% in the second quarter (U.S. Bureau of Economic Analysis).

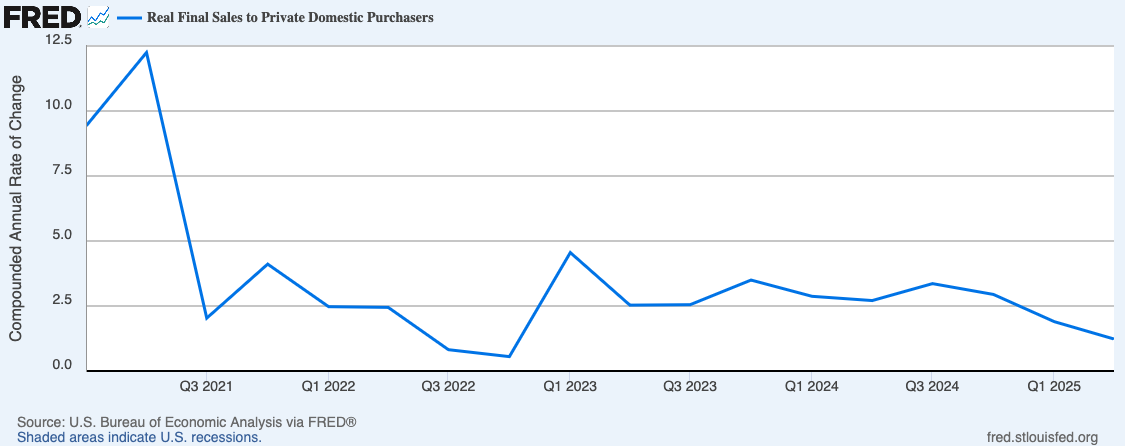
Contrary to what the headline GDP figures show for this quarter, trends in private domestic demand indicate U.S. economic growth may actually be slowing.

Economic Growth by Presidential Administration

A couple of weeks ago I gave a speech in which I anticipated that the audience would like to have some discussion about the potential economic effects of the upcoming presidential election in the U.S.

To support the discussion, I worked with one of our economics students at St. Mary’s  University to create a chart showing the growth in gross domestic product for the U.S. by presidential administration.

growth-by-presidential-administration

As shown in the graph, GDP growth during Democratic administrations averaged 4.13% and during the Republican administrations, growth averaged 1.77% if you include the Great Depression and 2.72% if you do not include the Great Depression. Without going into more in-depth analysis, it is difficult to make too much of these numbers. I do not think it is correct to just attribute strong or weak growth only to the policies passed during any of these administrations. They can certainly have effects on the economy during their times in office, but the strength or weakness of the economy during most presidential administrations is often due to some extent to the policies implemented well before a president takes office.

For example, some of President Hoover’s policies certainly made the Great Depression worse, but I do not think one can attribute the entire Depression to him. President Roosevelt was the beneficiary of the growth after the Great Depression, the massive amount of spending during World War II, and the fact that he was in office for twelve years. President Obama took office as the economy was at or near the depths of the Great Recession, the cause of which I would attribute to policies implemented by Presidents Reagan, Clinton and Bush 43.

There are other studies that go into more depth on growth during the presidential administrations that I may write about in future blog posts. As previously mentioned, while it is difficult to say much about growth during specific presidential administrations based only on the data presented in this chart, there is one fact worth noting. I hear quite a bit that the economy slows or even goes into recession during Democratic administrations, but as shown in the graph, that is clearly not the case.

In fact, it is just the opposite.


SN logo no name

Why Study Economic History

I just finished reading Paul Ormerod’s book, Positive Linking: How Networks Can Revolutionise the World. It is a great book, in which he clearly makes the case that if we truly want to understand how the economy functions then we have to understand the role of networks. In the course of part of this discussion, he also provides a great illustration of why we should study economic history. This is a long quote that spans several pages in the book, but I think it is worth it.

     In the week of 15 September 2008 capitalism nearly ground to a halt, Share prices collapsed. Credit markets froze. And we were within hours of cash machines, ATMs, being closed to the public.

     It was the American authorities who really saved the world in that terrifying week. And they did so not by the manipulation of elegant rational expectations models and theories, but by experiment and by relying on their knowledge of what had gone wrong in the Great Depression of the 1930s. Faced with a wholly uncertain immediate future, the authorities reacted by trying rules of thumb, by seeing what worked and what did not. They reacted exactly as Herb Simon said humans behaved all those years ago. They knew it was impossible to work out the optimal strategy. So they tried things which seemed reasonable and, quite literally, hoped for the best.

     It was fortuitous – and an important illustration of the role of chance and contingency in human affairs – that the chairman of the Federal Reserve at the time, Ben Bernanke, was a leading academic authority on the Great Depression. He knew that, above all, the banks had to be protected. It may seem monstrously unfair that the bankers themselves escaped penalties – indeed, it is unfair – but the abiding lesson of the 1930s is that in a financial crisis the banks have to be defended. Money is the blood which flows through the economy to keep it alive. If the chairman instead had been, say, a world expert on dynamic stochastic general equilibrium models, we would almost certainly now be in the throes of the second Great Depression.

     Bernanke had already restored a concept which is absent from the rational behavior rule book, that of ‘moral suasion’. Moral suasion, the central bank ‘persuading’ bankers to make particular decisions, is how banks used to operate before the complicated, rule-based, hugely expensive bureaucratic control systems based on concepts of ‘market failure’ were introduced…

     The key point about all these actions is that the American authorities paid no attention to academic macroeconomic theory of the past thirty years. RBC theory, DSGE models, rational expectations – all the myriad erudite papers on these topics might just as well have never been written. Instead, the authorities acted. They acted imperfectly, in conditions of huge uncertainty, drawing on the lessons of the 1930s and hoping that the mistakes of that period could be avoided (p. 183-184 and 190, electronic version).

To me, this is a clear (and dramatic) example of why it is important to study and understand the lessons of economic history.