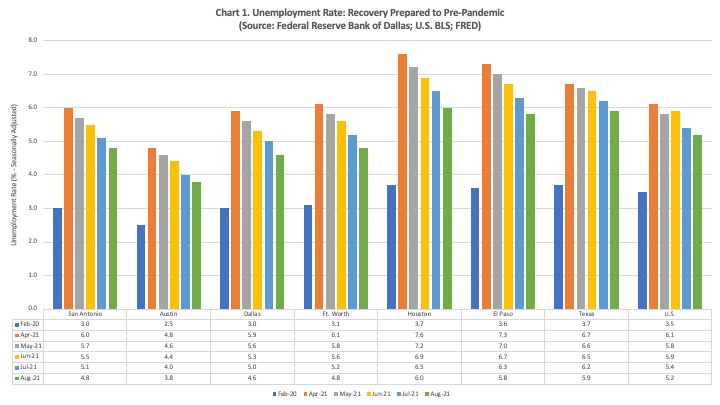
The unemployment rate continued its decline in August across the major metropolitan economies in Texas and across the State and U.S. as the recovery from the economic effects of the pandemic continue (see Chart 1). In San Antonio, the unemployment rate declined to 4.8%, This is 1.8 percentage points above the pre-pandemic level, so while the economy is certainly recovering, there is still a ways to go. San Antonio has the third lowest unemployment rate compared to the other major metropolitan economies in Texas with Austin having the lowest at 3.8%. The unemployment rate in Texas stood at 5.9%, a bit higher than the unemployment rate for the U.S. at 5.2%.
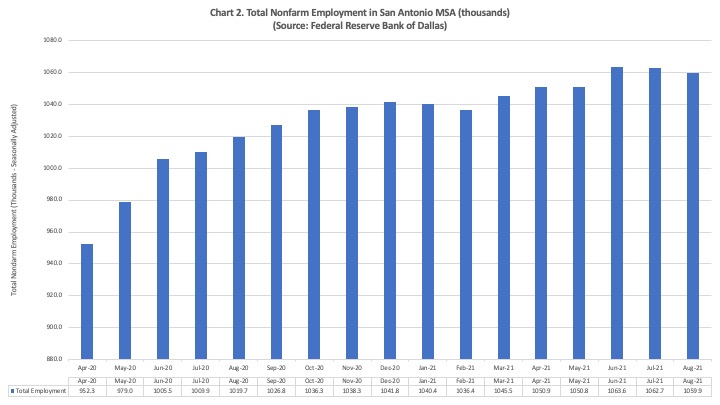
However, the total level of employment in San Antonio declined in July and August, as shown in Chart 2. This indicates to me that at least part of the decline in the unemployment rate in San Antonio may be due to people dropping out of the labor force and therefore, no longer being counted in the unemployment rate. This is also occurring in some of the other major metropolitan economies across the state.
While there have been monthly declines in total employment the past couple of months, the year-over-year growth rates in employment continued to be strong in August with growth in San Antonio coming in at 3.94% (see Chart 3), a good bit above the average historical growth rate in the region of about 2.3%. However, these growth rates continue to decline across most regions in the state, as well as across the entire state of Texas and the U.S. This is likely due to a regression to the mean as the recovery continues and some pull back in consumer spending due to the Delta variant. Another possible factor is the lag in business travel due to the pandemic. This especially affects those local economies with large leisure and hospitality industries like San Antonio because the convention activity is not filling in for the decline in leisure travel as the new school year began.
If we can keep making strides against the pandemic, growth should continue into the near future. This does not mean the year-over-year growth rates will increase, as they will likely tend to move more toward their long-term average rates in the respective areas as the economy gets closer to full employment. The sustained growth will also continue to push the unemployment rates down, especially as the structural unemployment is reduced.
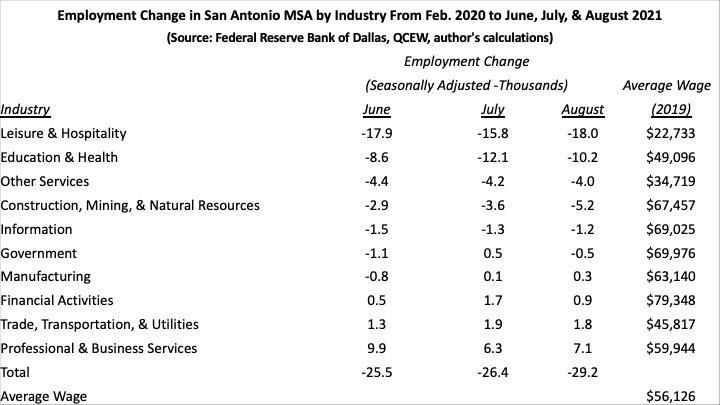
Employment in the San Antonio economy actually declined in July compared to June, as shown in the following table. Compared to the employment level in Feb. 2020, the month before the pandemic hit, employment in San Antonio was still down 25,500 jobs as of June and then in July decreased another 900 jobs to now being off by 26,400 jobs. The employment situation worsened in August as total employment was down 29,200 jobs compared to February 2020. These trends are probably reflecting many novel factors at play in the labor market, not only in San Antonio but across the U.S. and the world.
The unemployment rate in San Antonio has declined from 5.5% in June to 5.1% in July, and now it is sits at 4.8% in August. If the unemployment rate is going down while employment levels are also going down, this seems to me to indicate that the decline in the unemployment rate is due to people dropping out of the labor force instead of finding jobs. This may be due, in part, to the reduction/expiration of unemployment benefits, but it does not seem to indicate that the removal of those benefits had the large impacts on employment that some believed would be the case. Other factors seem to be driving workers’ decisions. Dr. David Autor puts forth an interesting explanation of what may be happening in his New York Times opinion piece (Autor, 2021). Regarding the effects of unemployment benefits, he refers to research showing that states which dropped the federal unemployment benefits this summer have seen very small declines in their unemployment rates. The Financial Times also recently published research on this same phenomenon (Smith and Zhang, 2021). Furthermore, Autor points out that Europe and Britain did not expand their unemployment benefits in a substantial way, and yet, they are also experiencing a labor shortage, too (Autor, 2021).
Having to put your son or daughter in child care has also been put forth as a possible explanation for the labor shortage, but as Autor notes, “women with children have since returned to work at almost the same rate as women without children, meaning access to child care isn’t the main culprit” (Autor, 2021).
He argues that the main reason for the labor shortage is “people’s valuation of their own time has changed.” In other words, many potential workers have decided that it is no longer worth working in a low wage job where they are also likely to be without benefits. As shown in the table above, those industries where wages are lowest are also those where there is high person-to-person interaction and thus, where workers are at increased risk of exposure to COVID. Instead, some are choosing to spend more time with their family and pursue other leisure activities that enhance their standard of living even if it reduces their incomes and consumption (Autor, 2021).
In addition to the explanation put forth by Autor, other factors may also explain what is happening in the labor market in San Antonio. It is clear in the table above that the leisure and hospitality industry and the education and health industry account for most of these job losses. As of June, leisure and hospitality accounted for 17,900 of the decline in jobs, and 8,600 of the jobs lost were in education and health. The employment situation improved in the leisure and hospitality industry in July where the reduction in employment compared to Feb. 2020 declined to 15,800, but the employment level worsened in August to 18,000 jobs. I think this may be due to the rather robust summer vacation season coming to an end followed by convention activity that is still depressed due to the pandemic. The situation got a bit worse in the education and health industry with employment being down 12,100 in July over this same time period but improved in August as the decline reduced to 10,200 jobs. The leisure and hospitality industry and education and health comprise a large part of the San Antonio economy. Besides the shift from leisure visitors to conventions as summer has ended that is possibly affecting employment in the leisure and hospitality industry, there is also much anecdotal evidence of workers in the leisure and hospitality and education and health industries leaving their jobs to seek employment in other industries for many of the reasons already stated. I suspect other metropolitan areas where these industries are a big component of the local economy are seeing similar effects.
It is also worth noting that in the industry that has shown the largest growth since Feb. 2020 by a wide margin, professional and business services, the growth declined from being up 9,900 jobs in June to only being up 6,300 jobs in July. Looking at the data on this industry in more detail, most of the decline occurred in the administration and waste services industry, for which I do not have an explanation. Employment levels did improve a bit in August with total employment in this industry being 7,100 jobs above the February 2020 level.
It is also important to keep in mind the wage levels of the workers most impacted by the economic effects of the pandemic. The average wage is presented in the table above and is calculated using data from the Quarterly Census of Employment and Wages for Bexar County. The average wage across all industries is $56,126 as of 2019, and of the four industries with below average wages, three of those industries are also the three most impacted by the pandemic in terms of declines in employment. This is no surprise as we have known that the economic effects of the pandemic have disproportionately fallen on those at the lower end of the income scale. As mentioned earlier, these are also likely to be the people most impacted by the loss of unemployment benefits, and given the other aforementioned factors at play in this labor market, it may also be deleterious to the overall economic recovery as their spending and engagement in the economy possibly declines.
Even more so, the adjustments happening on the supply-side of the labor market as discussed above indicate that the persistent labor shortage is due to structural changes, as workers reassess the value of their time and/or seek to transition to employment in different industries or different jobs in the same industry. The upshot is that the recovery back to pre-pandemic employment levels will take longer than if these effects were not occurring. This means that facilitating these adjustments is of utmost importance to helping those seeking to transition to new careers, but it is also vital to reducing the time it takes the economy to fully recover.
Income inequality has been a serious issue in the U.S. for many years now. The coronavirus pandemic has not only very clearly exposed the income inequalities across the country, but it has also blatantly displayed the devastating effects of such inequality. For a great exposition of these effects, I encourage you to read Unbound: How Inequality Constricts Our Economy and What We Can Do about it by Heather Boushey. I am starting to research further into the inequality in San Antonio and the other major metropolitan areas across Texas. I will document this research here but thought I would begin by sharing the findings of one study that delves deeply into the issue across states, metropolitan areas, and counties.
One of the first studies I discovered in this research is a report published by the Economic Policy Institute in 2018, “The New Gilded Age: Income Inequality in the U.S. by State, Metropolitan Area, and County,” by Estelle Sommeiller and Mark Price (https://www.epi.org/publication/the-new-gilded-age-income-inequality-in-the-u-s-by-state-metropolitan-area-and-county/#epi-toc-4). They calculate income inequality as the ratio of the average income of the top 1% to the average income of the bottom 99%. In this report, they provide the numbers for 2015. The level of income inequality by this measure in the major metropolitan areas of Texas and the state are provided in the following table.
In the table, a lower ratio indicates a lower level of inequality. Of the major metropolitan areas in Texas, El Paso has the lowest level of inequality with a ratio of 13.6, and it is the only MSA with a ratio below the median of all metropolitan areas in the country. San Antonio has the second lowest ratio at 20.4, which is higher than the median of 15.5. Houston has the highest level of inequality with a ratio of 25.5, but this is just slightly higher than Austin and Dallas-Fort Worth. The ratio of income inequality in Texas is 24.2, which is higher than the ratio of the median state (South Carolina) at 19.7 but lower than inequality in the U.S. with a ratio of 26.3.
These figures only show inequality as of 2015 by this one measure. I will explore the changes in inequality over time, as well as look at it by other measures.
As the government debt is swelling dramatically in the U.S. and other countries, there is concern that such high levels of debt will depress economic growth in the future. Research by Reinhart and Rogoff (2010) and Reinhart, Reinhart, and Rogoff (2012) indicate the threshold in which the level of debt as a proportion of GDP where growth rates start to decline is ninety percent. Others have argued that such a threshold does not exist because it is not the high debt that is causing growth to slow, but rather, it is slow growth that is causing the level of debt to escalate (Panizza and Presbitero, 2012; Herndon, Ash, and Pollin, 2013).
Pescatori, Sandri, and Simon (2014) take a little different look at the possibility of the existence of such a threshold and contribute some interesting insights. They look at different thresholds instead of focusing on just one, such as ninety percent, and they analyze growth performance over longer periods of time (5, 10, and 15 years) instead of just during the year after which a country’s debt level cross a threshold. This allows them to analyze the effects of changes in debt levels on growth and the longer-term effects. It also accounts for the potential reverse causality effects and the outlier periods of growth. Additionally, it mitigates some of the effects of omitted variables, such as automatic stabilizers (e.g., unemployment insurance).
Their findings are quite interesting.
…The sharp reduction in the following year’s growth that we observed in countries whose debt rose above 90 percent is no longer present for countries that have high but declining debt. In fact, even countries with debt ratios of 130 to 140 percent that are on a declining path have experienced solid growth. This suggests that high debt itself is not causing the low growth in these episodes. Furthermore,…the initial debt trajectory remains important event after 15 years, with falling debt associated with higher growth. That is, the trajectory of debt appears to be an important predictor of subsequent growth, buttressing the idea that the level of debt alone is an inadequate predictor of future growth [emphasis mine] (Pescatori, Sandri, and Simon, 2014, p. 41).
The data they analyzed covered the period from 1875 through the end of the last century. Recognizing that the wide variability in growth rates over some periods of this history (e.g., Great Depression, period following World War II) might distort their results, they “compared an economy’s average growth rate during an episode with the simple average of growth rates for all economies over the same period” (p. 41). Even after this adjustment, they still found
“that, in general, the growth performance of economies with high debt is fairly close to that of their peers with lower debt…Furthermore, we found that an economy’s debt trajectory still matters. Among economies with the same debt levels, the growth performance over the next 15 years in countries in which debt is initially decreasing is better than in countries where it is initially increasing…It is particularly striking for debt levels between 90 and 115 percent of GDP (for which average growth is 1/2 percentage point higher). Furthermore, there is no unique threshold that is consistently followed by a subpar growth performance…Economies with a debt level between 90 and 110 percent of GDP outperform their peers when debt is on a declining trajectory. At the least, this suggests that the debt level alone is insufficient to explain the growth potential of an economy. It also suggests that countries that have dealt with their budget deficits (as indicated by a declining debt level) may be well placed to growth in the future despite high debt levels” (Pescatori, Sandri, and Simon, 2014, p. 41).
They develop a few policy implications from this research. One is that since there does not appear to be any threshold effect, governments can engage in short-term fiscal stimulus, such as is being done in many countries in response to the pandemic, without being concerned that once they cross a certain threshold with debt, economic growth will slow. It is the trend in the debt to GDP ratio that matters, so what has the trend been in the U.S.?
The chart above shows the debt to GDP ratio in the U.S. The data only go through Q4 2019, so it does not include the current stimulus in response to the coronavirus pandemic. Once that is taken into account, this ratio will move even higher. It does not appear that the trajectory of the level of U.S. is moving in the right direction over the past decade. This is clearly due in part to the response to the Great Recession, but even during the historically long growth period following that recession, the level of debt compared to GDP continued to grow. This does not mean we should not be pursuing a stimulus in response to the pandemic, but as noted by the authors, the U.S. will need to reverse this trend once the economy gets back on track if the high level of debt is not going to have deleterious effects on the future growth rate of the U.S. economy.
References:
Herndon, T., Ash, M., and Pollin, R. (2013). Does high public debt consistently stifle economic growth? A critique of Reinhart and Rogoff. Political Economy Institute Working Paper No. 322 (Amherst, Massachusetts).
Panizza, U., & Presbitero, A.F. (2012). Public debt and economic growth: Is there a causal effect? MoFIR Working Paper No. 65 (Ancoma, Italy: Money and Finance Research Group).
Recently, the unemployment rate in the U.S. in April was reported at 14.7%, which may actually be about 5% higher as discussed in my post from yesterday. In my projection of the effects of the pandemic on the San Antonio economy, I forecast that the unemployment rate in San Antonio might reach between 14-21%. The unemployment rate for Texas and the metropolitan areas will not be reported until May 22, so the question is: what will the unemployment rate in San Antonio be in April? Going back to January 1990 (as far back as data on the unemployment rate in San Antonio are reported), the monthly average unemployment rate in San Antonio was 4.9% compared to the average U.S. unemployment rate of 5.8%. So, the unemployment rate in San Antonio is 0.9 percentage point lower than the U.S. rate on average. If this relationship holds, this means the unemployment rate in San Antonio in April will be 13.8%. “If this relationship holds” might be a big assumption, since the industries that have taken the brunt of the impacts of the pandemic – accommodations and food services, retail, and health care – are such a large part of the San Antonio economy. This could mean that the unemployment rate in San Antonio in April will be about the same or possibly even higher than the rate for country.
The unemployment rate in the U.S. was recently reported to be at 14.7% in April. Here is a link to the full report released by the U.S. Bureau of Labor Statistics. It is somewhat lengthy, but as always, it is worth a quick look, especially since this report contains some insightful information beyond the headline unemployment rate.
One insight is the difficulty in being able to correctly capture the data due to the unique situation caused by the pandemic. This is highlighted in the following statement from the report.
However, there was also a large increase in the number of workers who were classified as employed but absent from work. As was the case in March, special instructions sent to household survey interviewers called for all employed persons absent from work due to coronavirus-related business closures to be classified as unemployed on temporary layoff. However, it is apparent that not all such workers were so classified.
If the workers who were recorded as employed but absent from work due to “other reasons” (over and above the number absent for other reasons in a typical April) had been classified as unemployed on temporary layoff, the overall unemployment rate would have been almost 5 percentage points higher than reported (on a not seasonally adjusted basis). However, according to usual practice, the data from the household survey are accepted as recorded. To maintain data integrity, no ad hoc actions are taken to reclassify survey responses (pp. 5-6).
As noted in the statement, they calculate that the unemployment rate would have been close to 20% if this data was accurately reported.
A second data point of note is that when those who are marginally attached to the labor force and the total employed part time for economic reasons are considered, the unemployment rate (technically referred to as U-6), was 22.8% in April (see Table A-15 in the report).
I hate to highlight more bad news, as if 14.7% of the labor force being unemployed was not bad enough, but in order to really understand the depth of the economic recession we are in, I think it is important to consider these figures.
Some definitions: Those marginally attached to the labor force include people who are not currently looking for a job but have indicated they would like to work and have looked for a job in the past 12 months. This also includes discouraged workers who have become discouraged about their prospects of finding a job and have dropped out of the labor force. Those employed part time for economic reasons are the workers who would like to work full time but can only find part time work.
Every couple of years I conduct an analysis of the economic impact of the creative industry in San Antonio, so it is time to release the numbers for 2018. The following table shows the economic impacts. The employment in the creative industry in 2018 was 21,086, and incomes amounted to almost $1 billion. The total economic impact as measured by output amounted to $4.0 billion. Once multiplier effects derived from the exports of the industry are taken into consideration, the creative industry supports employment across the San Antonio economy equivalent to 26,684 full-time equivalent positions. The incomes these workers earned totaled almost $1.3 billion, and the overall economic impact was $4.8 billion.
The industry also grew strongly from 2016 to 2018 based on the overall impacts (i.e., including multiplier effects). Employment grew by 7.2% with incomes growing by 15.1%. Overall economic impacts grew 21.4% over this two-year period.
In order to give a sense of the impacts of the various sectors of the creative industry, the following tables shows the employment, income, and output impacts by sector within the creative industry. These are the direct impacts, so they do not include multiplier effects. As has been the case in the past, the sectors with the largest impacts are printing, advertising, and related activities; design and advertising; and performing arts.
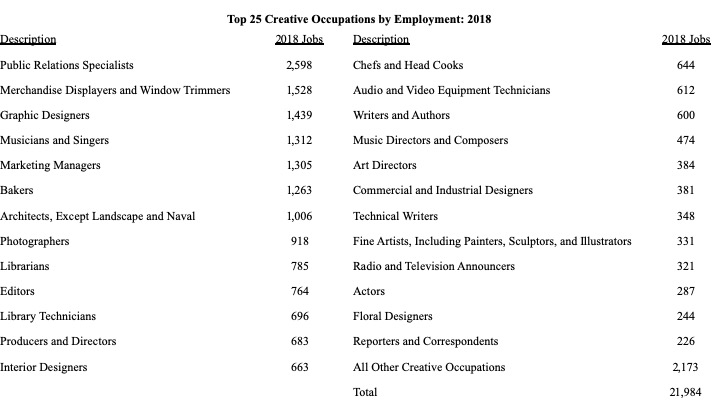
Lastly, we always take a brief look at the employment by creative occupation. The figures above are based on definitions by the NAICS industry codes, so the employment in the firms in these sectors includes all workers, regardless of whether or not they are engaged in creative work. However, the creative industry, or rather creative workers, play a somewhat unique role in the economy because they work in a variety of industries, including those that are defined as “creative.” Additionally, the firms in the creative industry support the growth of firms across all industries through the goods and services they provide. Looking at employment by creative occupation highlights these impacts in a very small way. This data indicate that there are 21,984 creative workers employed in all industries across the San Antonio economy.
Summary of the Methodology
The geography used in the analysis was the San Antonio metropolitan statistical area. The employment and income data were provided by EMSI. This is the same data source that has been used in the previous studies of this industry, and it is used because it includes measures of the non-QCEW and self-employed workers. Self-employed artists are a key component of the creative industry who would not be captured by using the data from the Quarterly Census of Employment and Wages (QCEW).
The conversion factors used to calculate the overall economic impacts were calculated using the sales and payroll data by industry from the 2012 Economic Census. The data from the 2017 Economic Census were not yet available at the time the analysis was conducted, which made it necessary to use the 2012 data.
In order to calculate the multiplier effects, the export data for each sector of the creative industry was pulled from the EMSI database and run through the IMPLAN input-output model.
In the January 16, 2020 edition of the Financial Times, Edward Luce reviewed three books trying to understand the rise of populism in the United States. One of the books he reviewed was Dignity by Chris Arnade, which sounds like a fascinating read, as do the other two books. I have not read any of the books, yet, but they all of them are at the top of my reading list beginning with Dignity. Luce’s review is a fascinating read, but one brief paragraph in his article really grabbed my attention. To provide some context to the quote, Arnade was a bond trader on Wall Street before quitting his job to travel to poor communities around the U.S. to observe an experience what poverty in America is really like instead of just relying on data analysis and theories. His observations were counter to his preconceived notions.
Arnade’s journey also taught him about the importance of place. Again and again, he would ask people in desperate straits why they did not simply pack up and leave. “Because this is my home,” they would reply as if talking to a child. Whether he was in a black or white neighbourhood, or mixed, the answer was usually the same. None of the Arnade’s spreadsheets could explain why. He had to leave his own world to understand why religion and place were the life rafts people clung to (Source given below).
The reply, “Because this is my home,” really struck me because in economics we more often than not assume perfectly competitive labor markets, and in order for such markets to exist, we assume labor is mobile. So, if workers find themselves in a situation where they are not making enough money (i.e., they are living in poverty), they will simply move to find a higher paying job, if possible. Clearly, this is not always possible (or reasonable to expect) and is yet another example of why we need to understand the sociological, psychological, and cultural elements of economic behavior, if we really want to understand it.
In their article, “The Phantom of the Opera: Cultural Amenities, Human Capital, and Regional Economic Growth,” Falck, Fritsch, and Heblich show that the presence of baroque opera houses in Germany helps attract “high-human-capital employees” to these regions. Upon showing this existence of this effect, they extend their analysis to see if these high-human-capital workers will generate knowledge spillovers. They state that: “Answering this question is of practical relevance for local government because in the absence of positive spillovers, it is difficult to justify using taxpayers’ money to subsidize cultural amenities” (Falck, Fritsch, and Heblish, 2011, p. 761). Their finding that cultural amenities do lead to knowledge spillovers and increases in productivity and economic growth is very interesting and important. While I agree with their statement about this being a justification to subsidize the arts, I think their is a nuance here that also need to be mentioned.
Even if there was no knowledge spillovers as they found, there could still be justification for funding of the arts based on the enhancements to the quality of life it brings to the residents of the community. I just feel the need to mention this because I think economics puts too much emphasis on growth in productivity and GDP. It is often argued that if a policy does not increase productivity or GDP growth then it is just not worth pursuing. I understand that these effects are all interrelated in that cultural amenities help attract and retain labor because it enhances quality of life, which could then drive economic growth higher. But, what if the cultural amenities just enhanced the quality of life of those living in the community without boosting economic growth? Could that value not be enough to justify subsidizing the arts? I argue that it could.
Falck, O., Fritsch, M., & Heblich, S. (2011). The phantom of the opera: Cultural amenities, human capital, and regional economic growth. Labour Economics, 18(6): 755-766.
It is that time of year for economic forecasts, so here is my forecast for the San Antonio economy in 2019. An update of the San Antonio economy through October and more detail on the forecast can be found here.
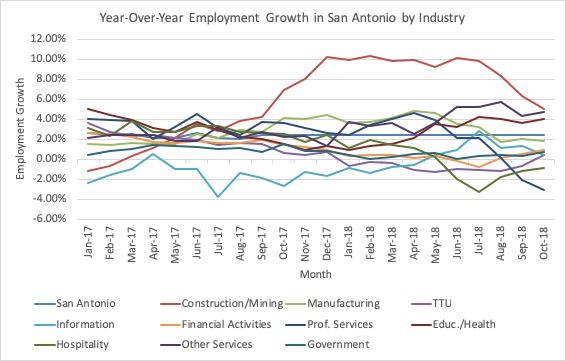
Like the U.S. and Texas economies, the San Antonio economy continues to show healthy growth. Employment through October grew 2.47% compared to October 2017, which is about at the historical average growth rate for the region. This is not bad given the extraordinary length of this expansion. The unemployment rate in San Antonio was at 3.2%, the second-lowest among the major metropolitan economies in the state. However, growth in San Antonio has been pretty strong across all sectors of the economy up until about six months ago when year-over-year employment growth in many sectors started to slow and even turn negative. These trends are shown in the following graph where it is clear that growth in the information, construction and mining, manufacturing, and professional and business services industries has started to decline.
It is also a sign of economic strength that the unemployment rate in San Antonio is so low. There is mounting anecdotal evidence, though, that the labor market is very tight. There are surely people who are still underemployed or who are not counted as unemployed because they have dropped out of the labor force, but I think we are at the point where growth is going to be driven by growth in the labor force and/or increases in productivity. This is going to be a constraint on growth into the near future.
Similar trends are also occurring at the state level, and the leading index for the Texas economy has been trending down since about May. It is too early to tell if this is an indication that the Texas economy is headed for a downward turn, but it bears watching.
On the national front, one of the best predictors of a downturn in the economy is the yield curve. The yield curve is very close to inverting, and in fact, the yield curve based on the difference between the 5-year and 2-year bond rates has already inverted. Once the yield curve inverts, it is a good bet the economy will move into a recession not too long after the inversion. Relatedly, recessions are typically preceded by the Federal Reserve raising interest rates, which they have been doing and are most likely going to continue to be doing. The housing market nationally and in San Antonio has been strong for a number of years now, but it got a bit frothy, again, and while it remains strong in San Antonio, it is starting to soften in other major metropolitan areas in Texas, particularly Dallas, and other parts of the country.
There are also some worrying trends in the global economy as growth has slowed in China and many countries of the European Union. While there are surely many factors playing into this, the trade war is not helping matters.
The current expansion is now the second-longest in our nation’s history. It is not going to go on forever. Sorry, but if we learned anything from the Great Recession, it is that the business cycle is not dead. There is typically a trigger, though, that turns the economy into a recession. As already mentioned, the inverting of the yield curve, raising of interest rates by the Federal Reserve (which, by the way, is the right thing for them to do, in my opinion), the trade war, Brexit, severe downturn in the housing market, and slowing global growth could each be that trigger. There may also be others not mentioned.
The upshot is that I believe we will continue to see the San Antonio economy grow into 2019, but I predict (as do many other economists) that we will move into a recession toward the end of 2019 or in 2020. It may not be as severe as the Great Recession, but I am very concerned about the federal government’s ability to respond to it. This is due to the fact that the Federal Reserve may not have as much room as they need to lower interest rates, which may mean they have to resort to quantitative easing again. But, there could be pressure not to implement such a policy again. A similar issue concerns me with respect to the ability of the federal government to provide any sort of fiscal stimulus given the increasing federal budget deficit due to the recent tax cuts of the Trump Administration. If the deficit is over $1 trillion by the time the recession hits, are the policymakers going to be willing to provide an economic stimulus large enough to pull the economy out of the recession, since it will make the deficit even worse?
In this environment, I think San Antonio will continue to see growth in 2019, but the growth in employment will likely slow to somewhere in the range of 1.75-2.25%. The unemployment rate is also likely to tick up a bit to about 3.5-4.0%.