Haven for Hope sets the standard for helping those who are experiencing homelessness. With their partners and numerous volunteers, they have provided care to 40,000 individuals since they began operations in 2010. I was fortunate to have the opportunity to conduct a cost-benefit analysis of Haven for Hope covering the period of its founding in 2007 through 2019. The benefits measured in the study included the economic and fiscal impacts of Haven for Hope operations, the economic and fiscal impacts of the volunteers at Haven for Hope, benefits of reduced crime, benefits of providing school stability to children, and the benefits of medical care, housing, and other care services. Measured against the costs of developing and operating the facilities and programs, the net benefits the organization provides to the community are impressive.
Net benefits to the community ranging from $2.9 billion to $8.2 billion with an average of about $5.6 billion.
Benefits to the community per dollar spent ranging from $15.29 to $41.89 with an average of $28.72.
Haven for Hope has not only had profoundly positive impacts on those they serve, but the effects on the quality of life and the economy extend throughout San Antonio. The report discussing the impacts in more detail and documenting how the analysis was conducted can be found here.
The San Antonio economy has bounced back from the pandemic-induced recession quite nicely, and I believe the economy will likely continue to show growth at or slightly above its long-term trend in 2022. I project employment growth this year to be in the range of 2.2-2.7%, and the unemployment rate will continue to decline to about 3.5-4.0%. The data, trends, and potential factors that I am seeing in my crystal ball that form the basis for this forecast are discussed in the rest of this post.
After a quick rebound from the pandemic-induced recession, the San Antonio economy has moved toward its more long-term average growth rate in employment. This is somewhat against the pattern seen in the other major metropolitan economies across Texas, as they have continued to maintain historically strong growth. This is especially the case for the Austin economy. These patterns are evident in the following chart showing the year-over-year employment growth. Even though many of these areas have continued to experience such strong growth, it is clear that there is a sizable gap between them and the Austin economy.
As shown in Chart 2, the Austin economy grew 8.11% percent in December, which was still substantially larger than the second-fastest growing region – Dallas – at 5.82% and Fort Worth, the third fastest growing region at 5.02%. The San Antonio economy grew 2.87% in December – the slowest among the major metropolitan regions and below the growth rate across the state of 5.08% and the U.S. at 4.52%.
The large disparities in the growth of the Austin economy relative to San Antonio, and the other major metropolitan economies in Texas for that matter, is worth exploring, and I will have a post on that soon. For now, I want to focus on San Antonio.
Chart 3 shows the year-over-year employment growth by month across broadly-defined industries from January 2019 through December 2021 for San Antonio. As expected, the hospitality industry took the largest dive during the lock down followed by the professional services industry. These two industries have also had the largest immediate recoveries, along with the other services industry.
Chart 4 and Table 1 show the employment growth by industry from the depth of the pandemic-induced recession in April 2020 to a year later in April 2021, i.e., from trough to peak, and then for the remainder of 2021. It needs to be kept in mind that these are similar lengths of time, but it is clear from these numbers that the growth rates across almost all of the industries in San Antonio have slowed considerably. The manufacturing, construction and mining, and education and health industries have seen their growth basically stall or even turn slightly negative in the last three quarters of 2021. The one exception is the hospitality industry that not surprisingly continues to experience growth far above average.
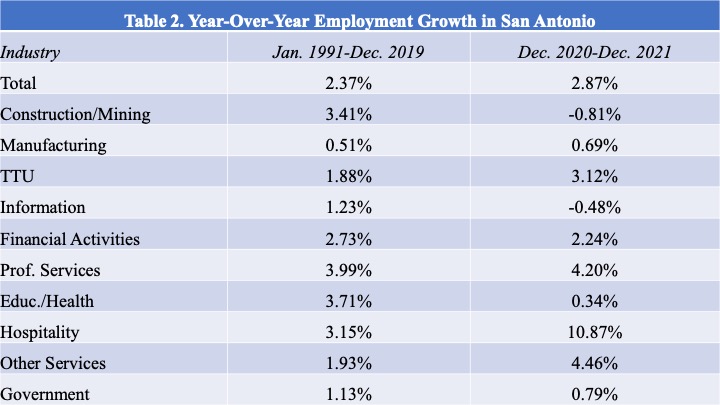
Table 2 compares employment growth in San Antonio over its history leading up to the pandemic (Jan. 1991-Dec. 2019) to the growth rates across industries over the past year. Overall employment growth in 2021 was 2.87%, a bit above the historical average of 2.37% growth. Five of the ten industries – manufacturing; trade transportation, and utilities (TTU); professional services; hospitality; and other services – continued to grow at above average rates in 2021. Not too surprisingly, the hospitality industry continues to lead the growth with a rate of 10.87% in 2021 – far above the industry’s historical average. Only two industries experienced declining growth in 2021 – construction and mining and information. As shown in Chart 3, the declining growth in the information industry is a regression back to the mean based on recent history. Not to give away too much of the punch line for my next post, but this explains, in part, the difference in growth rates between Austin and San Antonio.
I expect these overall slowing trends in employment growth to continue through 2022 in San Antonio. Some of this is just going to be a regression back to the mean from the large growth rates as the economy recovered from the pandemic-induced recession. The structure of the San Antonio economy is an additional reason, and the potential effects of growth in the global and national economies will also play a role, as discussed below.
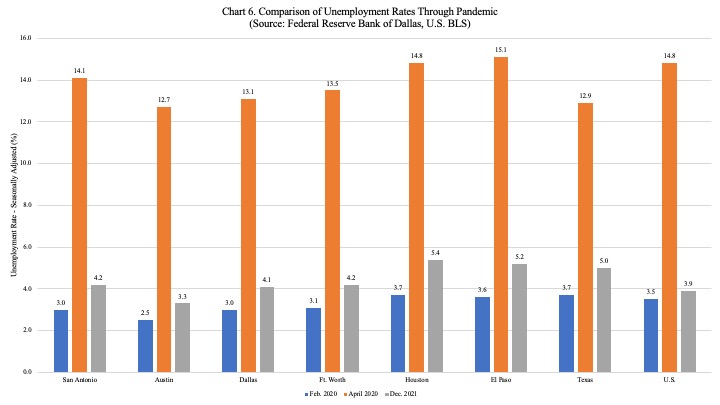
Similar to the pattern in the other major metropolitan Texas economies and across the state and U.S, the unemployment rate in San Antonio has steadily declined after the precipitous fall following the re-opening of the economy ending 2021 at a rate of 4.2% (see Chart 5). As shown in Chart 6, San Antonio had one of the lowest unemployment rates among the major metropolitan economies in Texas before the pandemic at 3.0%. However, San Antonio experienced one of the largest surges in its unemployment as it climbed to 14.1% in April 2020 at the depth of the recession, but as noted, unemployment has been consistently declining and is similar to the rate in Dallas (4.1%) and Fort Worth (4.2%). The unemployment rate in San Antonio is also lower than the statewide rate at 5.0%, but it is a bit higher than the U.S. unemployment rate at 3.9%. Compared to San Antonio, the unemployment rate in Austin was 0.9 percentage point lower at the end of 2021 at 3.3%. The strong economic growth since April 2020 has surely been the main driver pushing unemployment rates down, but it should be kept in mind that at least part of this decline may be due to the decline in the labor force participation rate due to the Great Resignation phenomenon. In fact, while the labor force participation has been increasing, it is still below the pre-pandemic rate of 63.4% in February 2020 for the U.S.
These structural changes in the labor market are one of the risk factors to this forecast. I can see these changes potentially having both positive and negative effects on economic growth. If the labor market adjusts to these changes fairly quickly and workers fill the jobs at higher pay and with enhanced benefits, this could serve as a boost to overall economic growth. However, if the current trend continues for an extended period of time, this could continue to exacerbate the shortages in many markets and serve to dampen economic growth. These adjustments in the labor market may be forestalled in industries where there is a relative paucity of benefits, such as paid sick leave. If the shortages causing the rapid increase in the inflation rate do not diminish in the near future, the persistent inflation at relatively high rates will also likely be a deterrent to growth in and of itself. In response to this, the Federal Reserve has sent strong signals that it will most likely be raising interest rates several times this year, which will also serve to slow the economy some. There could also be bubbles in many asset markets, such as the stock and housing markets, and if one or more of those bubbles burst, they might also cause the economy to pause a bit, even if it does not push it into a recession. The strong economic growth was, at least in part, driven by the federal government stimulus, and with that coming to an end, consumer spending is likely to move back into a more typical pattern over time causing a moderation in U.S. economic growth. It is also likely that growth in the global economy will also slow this year because of similar trends, and the economic effects of the war in Ukraine may also slow global economic growth a bit. Overall, it seems these various factors combined with the structure of the San Antonio will mean the local economy will continue to grow fairly strongly in 2022 but at a slower rate than in 2021.
I recently completed an economic impact analysis of the culinary industry in San Antonio in 2019 and 2020 for the San Antonio City of Gastronomy program. A summary of the results is shown in the following table. For the detailed results, please see the full report.
The culinary industry in San Antonio directly employed 125,770 workers and paid wages and benefits of $4,4 billion in 2019. The industry had a direct economic impact as measured by output of about $16.6 billion. The direct contributions to gross regional product (GRP) of the industry totaled $7.1 billion. However, with the impact of the COVID-19 pandemic, these impacts declined in 2020 with direct employment in the industry falling to 110,121 and wages and benefits declining to $4.0 billion. Direct economic impact shrank to about $15.8 billion, while the industry’s contribution to gross regional product fell to $6.5 billion.
When multiplier effects are included, the total employment supported by the culinary industry in San Antonio in 2019 was 227,764 workers who earned wages and benefits of almost $8.0 billion. The total economic impact on the local economy as measured by output amounted to $29.3 billion, and the industry’s contribution to GRP in 2019 was $13.4 billion. Like with the direct impacts, the total impacts declined in 2020. Total employment supported by the culinary industry declined to 208,642 jobs with incomes of $7.3 billion. The total output (i.e., economic impact) fell almost $1.5 billion to about $28.0 billion, and the total contribution to GRP declined 6.9% to $12.5 billion.