Declining Employment Growth in U.S., Texas, San Antonio, and Other Major Metropolitan Economies
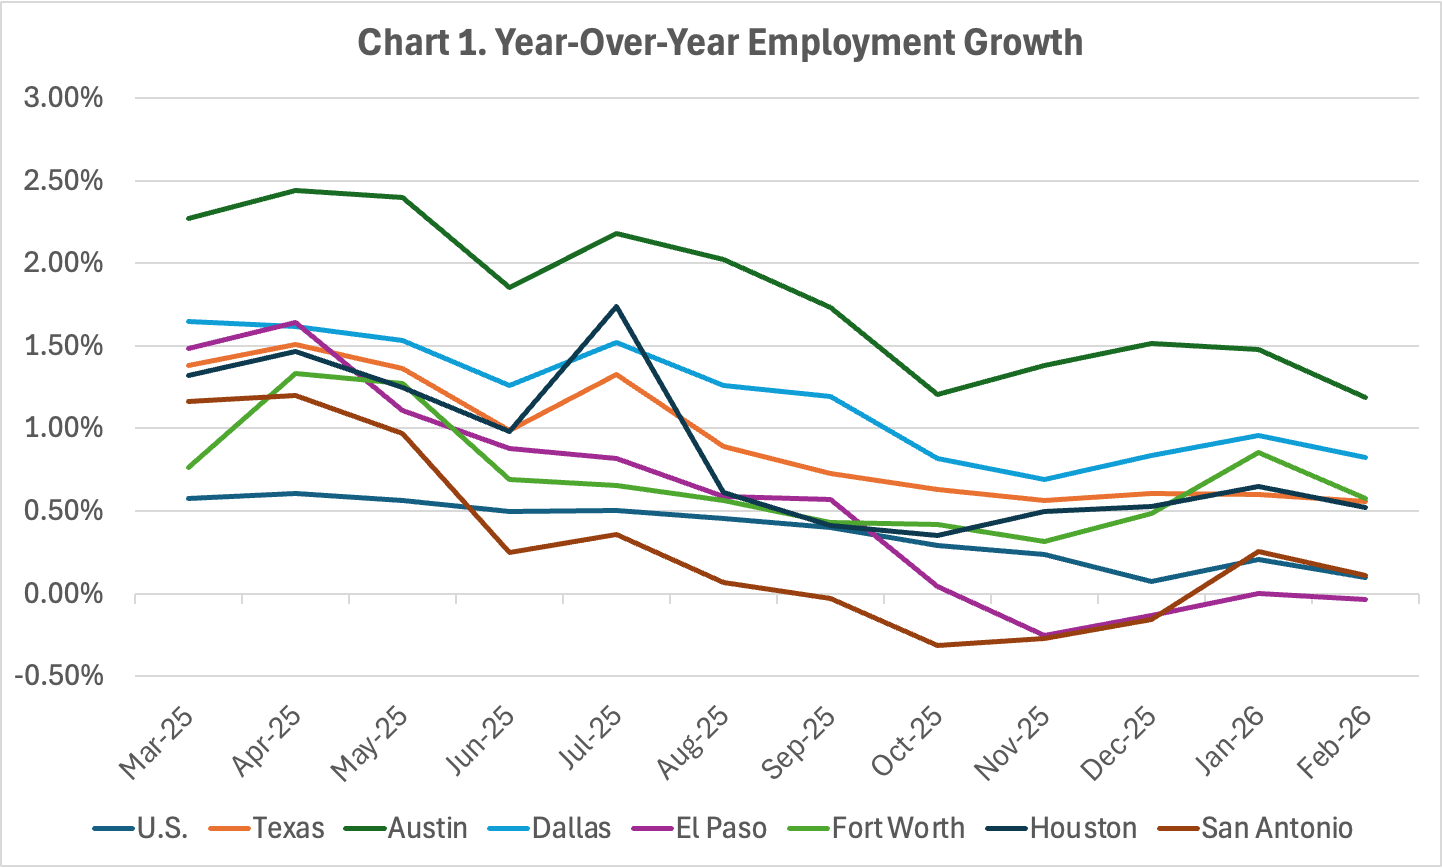
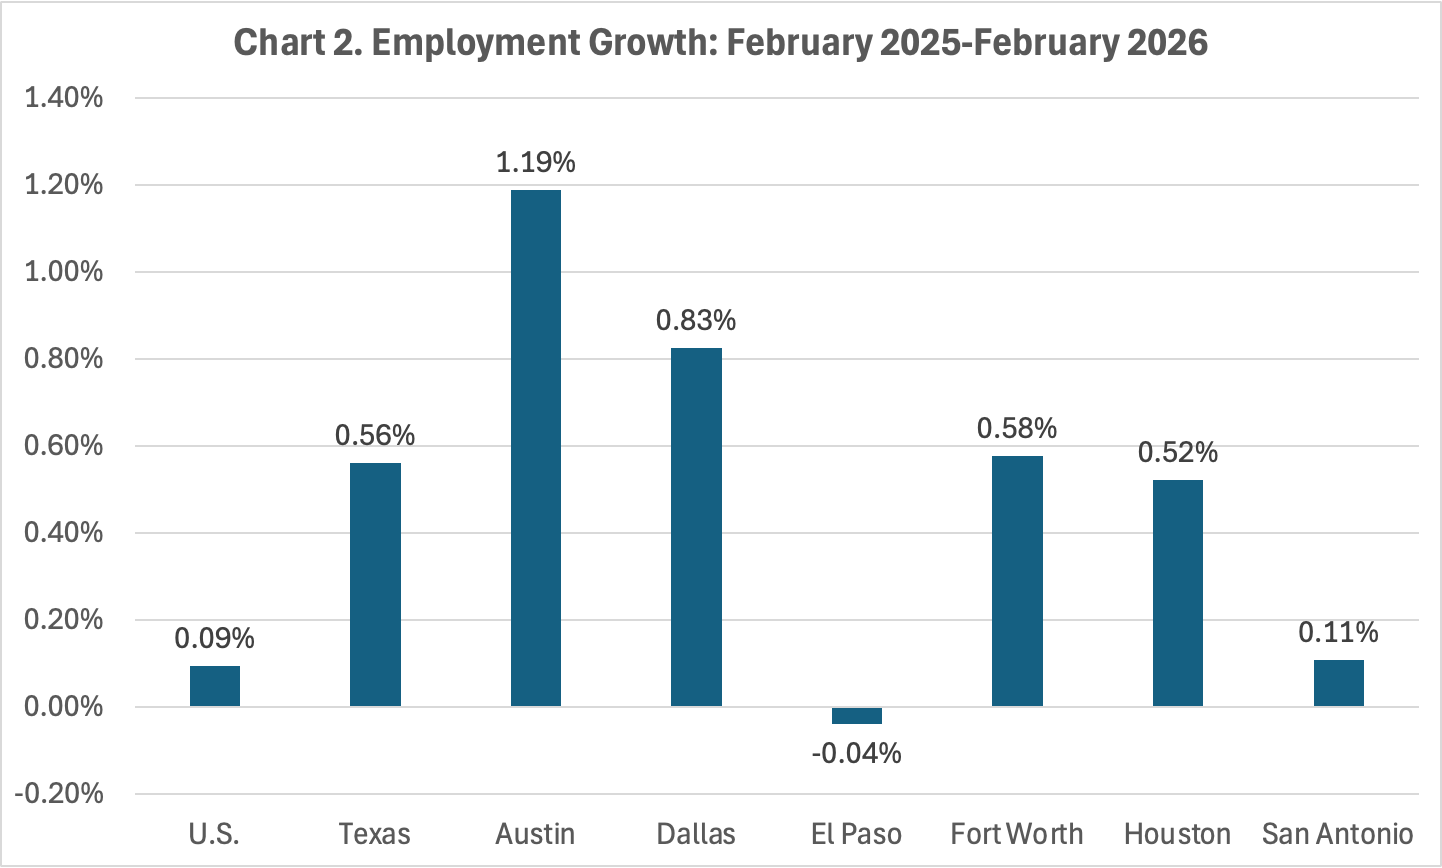
Year-over-year employment growth in the U.S. and Texas, including the state’s major metropolitan areas was lethargic and continued on a steady downward trend through 2025 and into the beginning of this year (Chart 1). In 2025, there was basically no growth in employment in the U.S. with a growth rate of 0.07%, and employment in Texas only grew by 0.61% in 2025. Among the metropolitan economies, the Austin-San Marcos MSA had the highest growth rate at 1.52%, while the San Antonio-New Braunfels area had the largest decline with employment shrinking -0.16% followed by El Paso with a decline of -0.13%. Employment growth in Dallas (0.84%), Houston (0.53%), and Fort Worth (0.49%) was basically flat in 2025. In the first two months of 2026, year-over-year employment growth improved slightly in January but tended to come back to growth rates similar those in 2025 (Charts 1 and 2). The fastest growing region in 2025, Austin, experienced a slowing in their employment growth in January and February. Employment growth in Texas also slowed at the beginning of this year, while growth in the U.S. has stayed about the same as it ended the year.
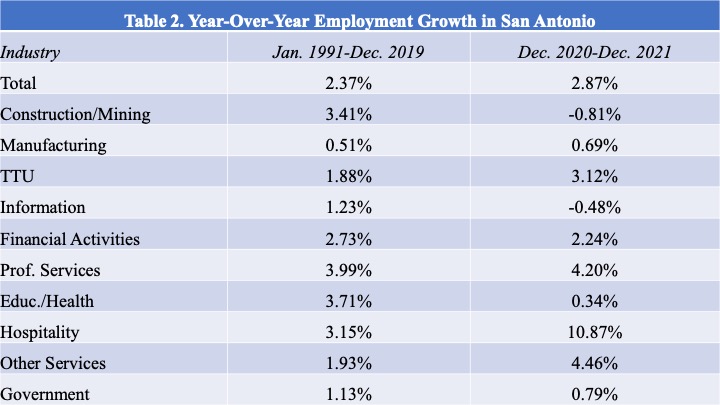
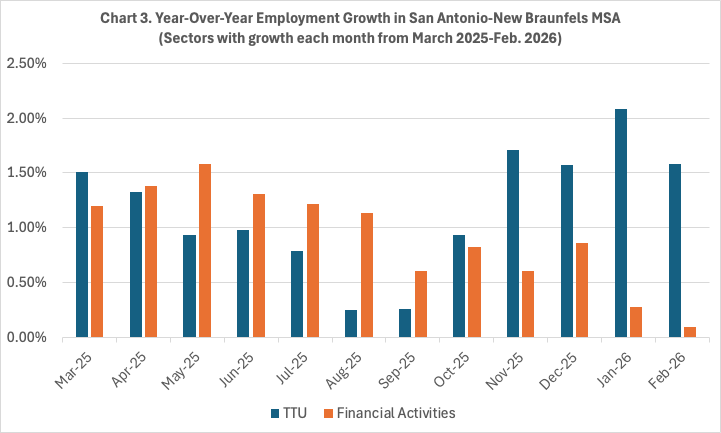
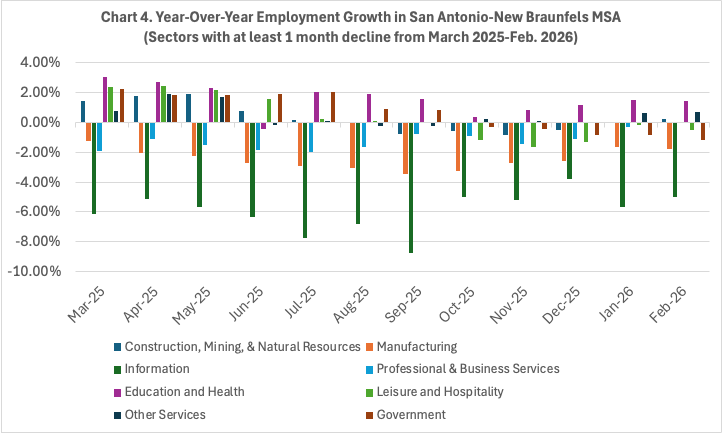
Dissecting the growth in the San Antonio-New Braunfels MSA, there were only two industries – trade, transportation, utilities (TTU) and financial activities – that saw their employment grow year-over-year in each of the twelve months from March 2025 to February 2026 (Chart 3). Eight of the industries in the region experienced a decline in employment in one month over this period, as shown in Chart 4. The charts shows the progressive decline in growth rates across most of these industries. The education and health; construction, mining, and manufacturing; and other services industries showed some rebound to positive growth toward the end of this period.
Based on the employment report released by the U.S. Bureau of Labor Statistics last Friday this pattern of weak employment growth in the U.S. continued into April. Total nonfarm employment increased by 115,000. Year-over-year, this is an increase of 0.16%. This follows growth of 0.15% in March. Nine industries showed employment growth from March to April – health care (+37,000); transportation and warehousing (+30,000); retail trade (+22,000); social assistance (+17,000); leisure and hospitality (+14,000); other services (+10,000); construction (+9,000); professional and business services (+7,000); wholesale trade (+6,000); and mining, quarrying, and oil and gas extraction (+3,000). Employment declined in information (-13,000), financial activities (-11,000), government (-8,000), and manufacturing (-2,000). When the figures for the state and metro areas are updated, I will update the charts and related discussion, but these figures for the U.S. indicate that employment growth in Texas and the major metropolitan areas likely will also continue to be relatively weak in March and April.
Steve